Friday Tips: Demystifying the Limiter’s Meter Options
Limiters are common mastering tools, so they’re the last processor in a signal chain. Because of this, it’s important to know as much as possible about its output signal, and Studio One’s Limiter offers several metering options.
PkRMS Metering
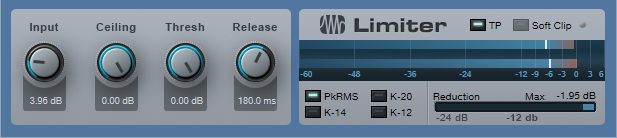
The four buttons under the meter’s lower left choose the type of meter scale. PkRMS, the traditional metering option, shows the peak level as a horizontal blue bar, with the average (RMS) level as a white line superimposed on the blue bar (Fig. 1). The average level corresponds more closely to how we perceive musical loudness, while the bar indicates peaks, which is helpful when we want to avoid clipping.
The TP Button
Enabling the True Peak button takes the possibility of intersample distortion into account. This type of distortion can occur on playback if some peaks use up the maximum available headroom in a digital recording, and then these same peaks pass through the digital-to-analog converter’s output smoothing filter to reconstruct the original waveform. This reconstructed waveform might have a higher amplitude than the peak level of the samples, which means the waveform now exceeds the maximum available headroom (Fig. 2).
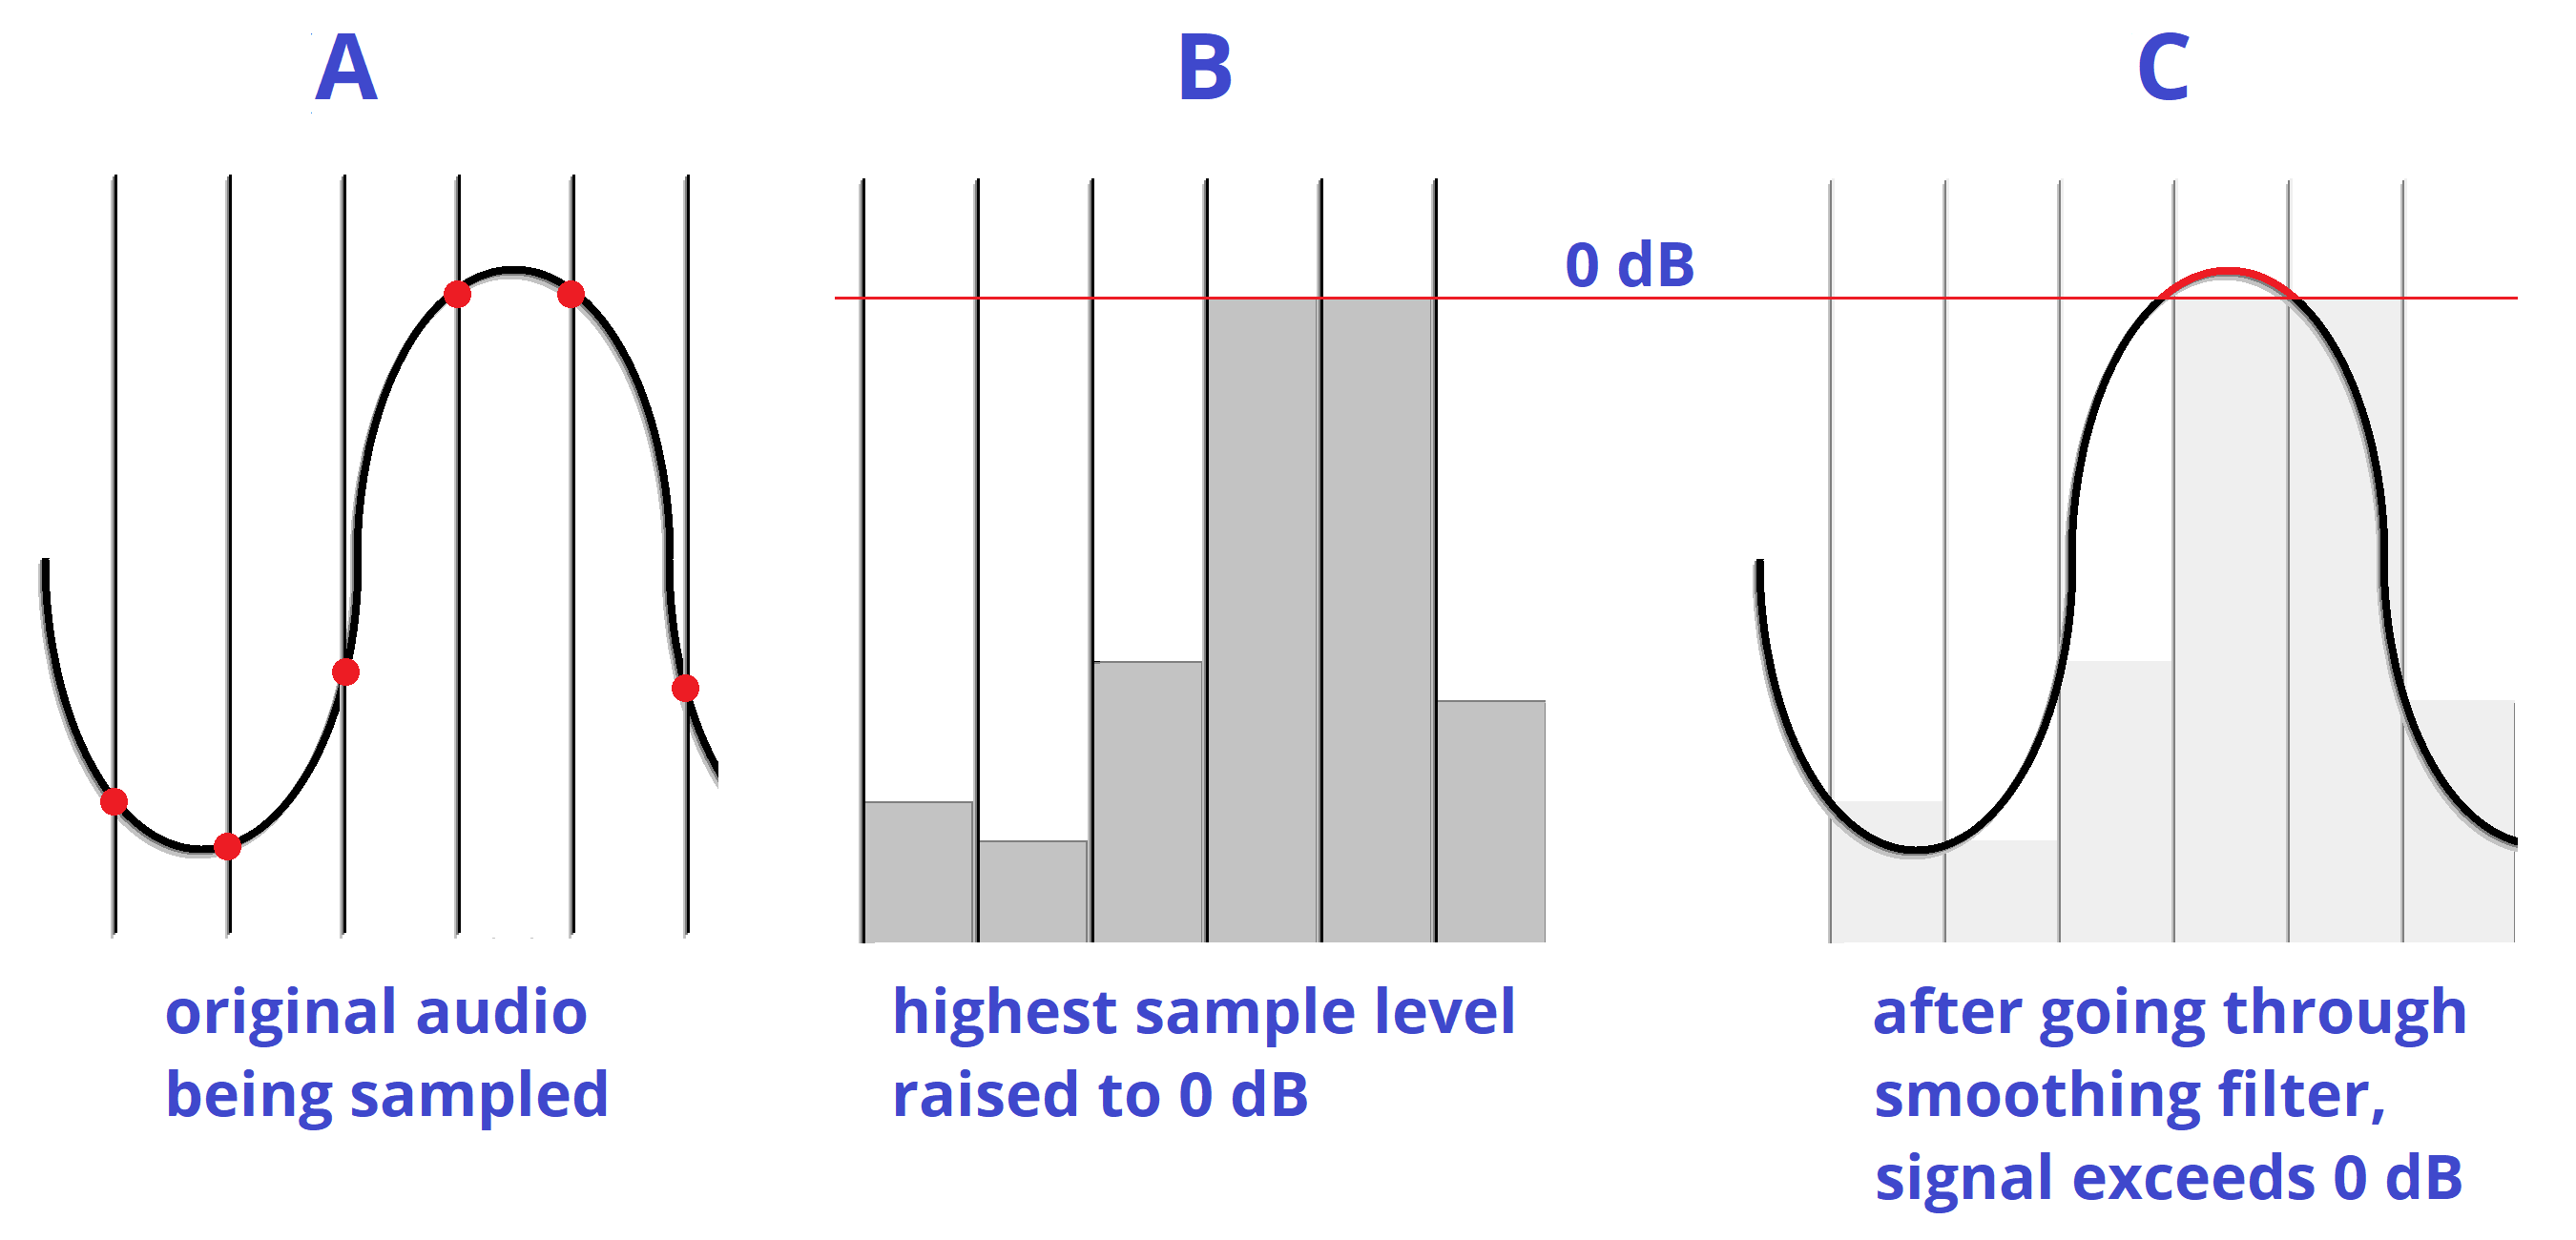
Figure 2: How intersample distortion occurs.
For example, you might think your audio isn’t clipping because without TP enabled, the output peak meter shows -0.1 dB. However, enabling True Peak metering may reveal that the output is as much as +3 dB over 0 when reconstructed. The difference between standard peak metering and true peak metering depends on the program material.
K-System Metering
The other metering options—K-12, K-14, and K-20 metering—are based on a metering system developed by Bob Katz, a well-respected mastering engineer. One of the issues any mix or mastering engineer has to resolve is how loud to make the output level. This has been complicated by the “loudness wars,” where mixes are intended to be as “hot” as possible, with minimal dynamic range. Mastering engineers have started to push back against this not just to retain musical dynamics, but because hot recordings cause listener fatigue. Among other things, the K-System provides a way to judge a mix’s perceived loudness.
A key K-System feature is an emphasis on average (not just peak) levels, because they correlate more closely to how we perceive loudness. A difference compared to conventional meters is that K-System meters use a linear scale, where each dB occupies the same width (Fig. 3). A logarithmic scale increases the width of each dB as the level gets louder, which although it corresponds more closely to human hearing, is a more ambiguous way to show dynamic range.

Figure 3: The K-14 scale has been selected for the Limiter’s output meter.
Some people question whether the K-System, which was introduced two decades ago, is still relevant. This is because there’s now an international standard (based on a recommendation by the International Telecommunications Union) that defines perceived average levels, based on reference levels expressed in LUFS (Loudness Units referenced to digital Full Scale). As an example of a practical application, when listening to a streaming service, you don’t want massive level changes from one song to the next. The streaming service can regulate the level of the music it receives so that all the songs conform to the same level of perceived loudness. Because of this, there’s no real point in creating a hot master—it will just be turned down to bring it in line with songs that retain dynamic range; and the latter will be turned up if needed to give the same perceived volume.
Nonetheless, the K-System remains valid, particularly when mixing. When you mix, it’s best to have a standardized, consistent monitoring level because human hearing has a different frequency response at different levels (Fig. 4).

Figure 4: The Fletcher-Munson curve shows that different parts of the audio spectrum need to be at different levels to be perceived as having the same volume. Low frequencies have to be substantially louder at lower levels to be perceived as having equal volume.
The K-System links monitoring levels with meter readings, so you can be assured that music reaching the same levels will sound like they’re at the same levels. This requires calibrating your monitor levels to the meter readings with a sound level meter. If you don’t have a sound level meter, many smartphones can run sound level meter apps that are accurate enough.
Note that in the K-System, 0 dB does not represent the maximum possible level. Instead, the 0 dB point is shifted “down” from the top of the scale to either -12, -14, or -20 dB, depending on the scale. These numbers represent the amount of headroom above 0, and therefore, the available dynamic range. You choose a scale based on the music you’re mixing or mastering—like -12 for music with less dynamic range (e.g., dance music), -14 for typical pop music, and -20 dB for acoustic ensembles and classical music. You then aim for having the average level hover around the 0 dB point. Peaks that go above this point will take advantage of the available headroom, while quieter passages will go below this point. Like conventional meters, the K-Systems meters have green, yellow, and red color-coding to indicate levels. Levels above 0 dB trigger the red, but this doesn’t mean there’s clipping—observe the peak meter for that.
Calibrating Your Monitors
The K-System borrows film industry best practices. At 0 dB, your monitors should be putting out 85 dBSPL for stereo material. Therefore, you’ll need a separate calibration for the three scales to make sure that 0 dB on any scale has the same perceived loudness. The simplest way to calibrate is to send pink noise through your system until the chosen K-System meter reads 0 dB (you can download pink noise samples from the web, or use the noise generator in the Mai Tai virtual instrument). Then, using the sound level meter set to C weighting and a slow response, adjust the monitor level for an 85 dB reading. You can put labels next to the level control on the back of your speaker to show the settings that produce the desired output for each K-Scale.
But Wait! There’s More
We’ve discussed the K-System in the context of the Limiter, but if you’re instead using the Compressor or some other dynamics processor that doesn’t have K-System metering, you’re still covered. There’s a separate metering plug-in that shows the K-System scale (Fig. 5).

Figure 5: The Level meter plug-in shows K-System as well as the R128 spec that reads out the levels in LUFS. Enabling TP converts the meter to PkRMS, and shows the True Peak in the two numeric fields.
Finally, the Project Page also includes K-System Metering along with a Spectrum Analyzer, Correlation Meter, and LUFS metering with True Peak (Fig. 6).

Figure 6: The Project Page metering tells you pretty much all you need to need to know what’s going on with your output signal when mastering.