Friday Tips: Testing, Testing!
Studio One has several analysis tools, and you can use them to learn a lot about how effects work. One of my favorite test setups is inserting the Tone Generator at the beginning of the Insert Device Rack to generate white noise (a test signal with equal energy throughout the audio spectrum), the Spectrum Meter at the end of the Rack, and the device under test in between them. Here’s the Tone Generator, set to generate white noise.

As one example of the benefits of testing gear, a lot of engineers like the gentle tone-shaping qualities of Pultec’s MEQ-5 midrange equalizer. So you need an MEQ-5 plug-in, or the hardware, to obtain that effect with Studio One…right? Maybe not.
One reason for the “sound” of Pultec equalizers is that they used passive circuitry, so the EQ curves were broad. But the Pro EQ can do gentle curves as well, simply by choosing a low Q setting. The screen shot shows Pro EQ settings for a “Pultec-like” curve, with a considerable amount of boost and cut.

But how much is it really like a Pultec? Let’s find out. Choose the same settings on the Pro EQ and on an MEQ-5, then run some white noise through both, using the Spectrum Meter’s FFT analysis.
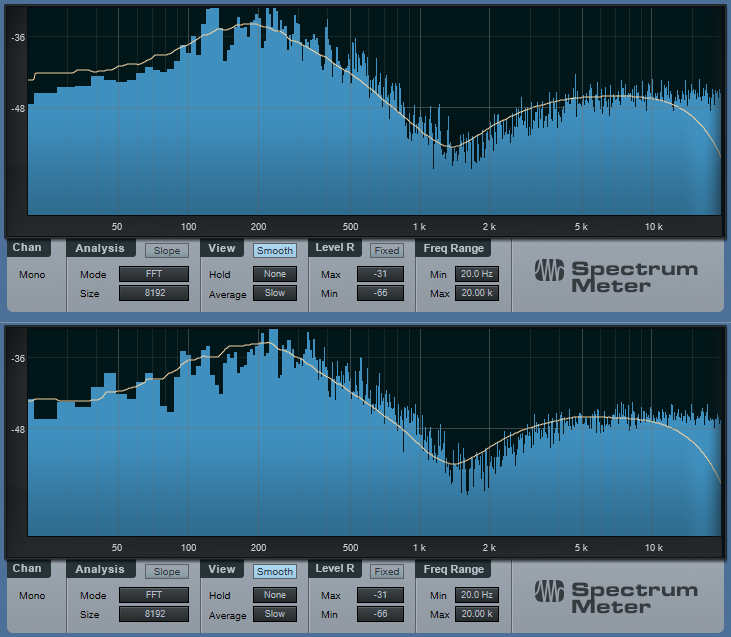
The white, smoothed line shows the average frequency response (white noise is changing constantly because it’s random, so in this case we want a smoothed, average reading). The top graph is the Pro EQ, and the bottom graph is the MEQ-5. Sure, there may be some subtle sonic differences due to the use of different filter topologies. But if you’re looking for those gentle, tone-shaping curves, the Pro EQ does just fine.
You can also find out exactly what’s going on with some effects. For example, Studio One has a phase shifter effect, and you probably know that phase shifting produces notches in the audio. But how deep are the notches? And how far apart are they? Let’s take a look.
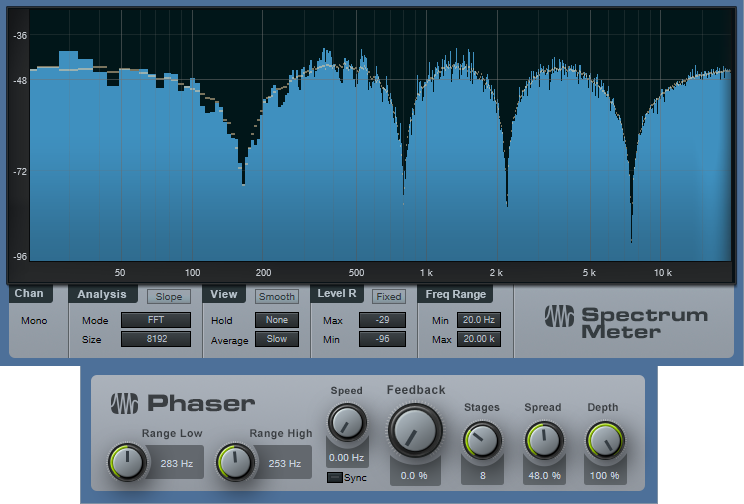
The Phaser is set to 8 stages, so there are 4 notches. For this measurement, we want to know the instantaneous value of the notches, so the average isn’t smoothed. With depth up full, the notches are around -35 dB or so.
While we’re at it, let’s check the frequency response of guitar cabinets, so we can find out why they sound so different from each other.
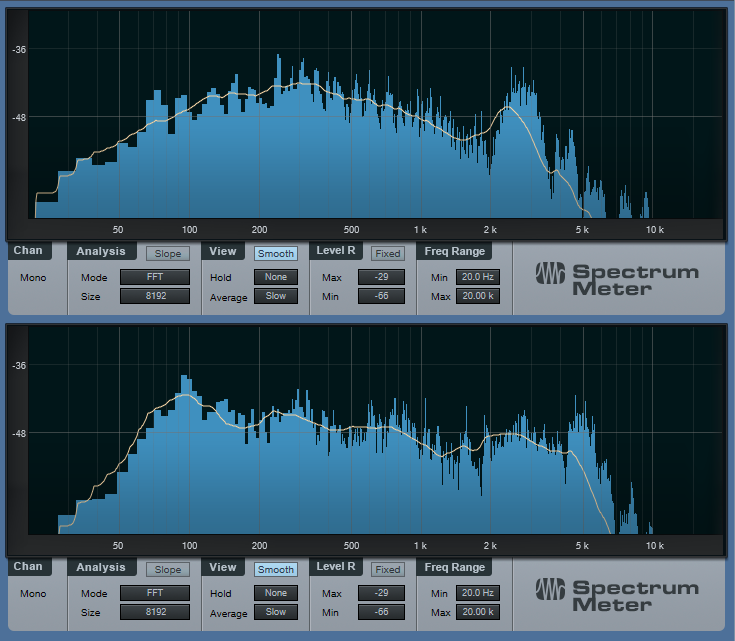
The upper image shows the response for a Mesa Boogie Mark IV cabinet. Note the prominent peak in the 3 kHz range, and the rolloff below 200 Hz—now you know why those solos can really cut through a mix. Compare that with the lower image of a 1965 Fender Princeton. It has a low end bump to give a full sound, a bit of a notch around 1.5 kHz, and has more high end above 5 kHz than the Mark IV.
As to why these readings matter, suppose you recorded a guitar part, and want it to have more of a Mesa Boogie vibe. Just tweak your EQ accordingly to approximate the curve.
Using white noise for testing can also show why SSL E-series and G-series EQ curves are different, the differences between standard and constant-Q parametric stages, what really happens when you move graphic EQ sliders around, and more. If you’re curious about scratching beneath the GUI of your effects, Studio One’s analysis tools can reveal quite a bit.